The primary stock exchange of Australia is the Australian Securities Exchange (ASX). Like other national exchanges, the ASX, too, has its own stock market benchmark.
This is the ASX 200 Index, which tracks the top 200 companies listed on the Australian Securities Exchange. However, the ASX 200 is not published by the ASX. Instead, it is published by S&P Dow Jones, and is considered the main benchmark of the S&P/ASX family of indices.
The ASX 200 is one of the most important stock market benchmarks in the region, owing to Australia’s status as a global financial hub. In this article, we will take a deep dive into the ASX 200, how it is constructed, and the trading potential it offers.
What is the ASX 200 Index? [1]
The ASX 200 tracks 200 of the largest stocks listed on the Australian Securities Exchange, serving as a barometer of the performance of the Australian economy at large.
The index is weighted by float-adjusted market capitalisation – a calculation method that excludes locked-in shares, and only counts shares that are available for trade in the market.
In other words, companies included in the ASX 200 are ranked according to size, derived by multiplying share price by the number of free-floating shares. This ensures a highly liquid and tradeable index.
Trading hours of the AXS 200 [2,3]
The ASX 200 follows the trading hours of the Australian Securities Exchange, which are as follows:
- Mondays to Fridays
- 10 am to 4 pm
- Pre-opening phase
- 7 am to 10 am
Traders may enter trades during pre-opening, but no trades will be executed until the market opens for the day at 10 am.
The ASX is closed on Saturdays and Sundays, as well as on national holidays, as follows [3]:
- New Year’s Day
- Australia Day
- Good Friday
- Easter Monday
- ANZAC Day
- King’s Birthday
- Last business day before Christmas (trading ceases at 2.10 pm)
- Christmas Day
- Boxing Day
- Last business day of the year (trading ceases at 2.10 pm)
What sectors are in the AXS 200? [4]
The AXS 200 draws constituents from all 11 major sectors of the Australian economy, as defined by the Global Industry Classification Standard. Here is the secretary breakdown of the index at the time of writing.
| Sector | Index weight (%) |
| Financial Services | 28 |
| Basic Materials | 22.9 |
| Healthcare | 9.5 |
| Industrials | 8.4 |
| Consumer Cyclical | 6.9 |
| Real Estate | 6.5 |
| Communication Services | 4.6 |
| Technology | 4.1 |
| Consumer Defensive | 3.9 |
| Energy | 3.4 |
| Utilities | 2.0 |
Top 10 constituents of the ASX 200 [5]
The top 10 constituents of the index at the time of writing are as follows:
| Company | Market cap (AUD) |
| BHP Group Ltd | 225.88 billion |
| Commonwealth Bank of Australia | 204.64 billion |
| CSL Ltd | 138.66 billion |
| National Australia Bank Ltd | 107.23 billion |
| Westpac Banking Corporation | 92.84 billion |
| ANZ Group Holdings Ltd | 84.99 billion |
| Fortesque Ltd | 81.93 billion |
| Wesfarmers Ltd | 79.09 billion |
| Newmont Corp | 74.55 billon |
| Macquarie Group Ltd | 74.04 billion |
Why trade the ASX 200?
The vast majority of stocks included in the ASX 200 are those of Australian companies, allowing investors to gain access to the broader Australian market. The index composition method using free-float market capitalisation ensures that only top performing, highly liquid stocks are included.
Investors can trade the ASX 200 to diversify their portfolio along regional lines, counterbalancing volatility that may be present in Western or Asian markets.
How to trade the ASX 200?
The ASX 200 is an index that simply measures the performance of underlying constituent stocks. The index itself does not hold any assets or shares, and thus cannot be directly invested or traded.
Instead, investors can trade the ASX 200 by investing in index funds that track the index, or via financial derivatives like Contracts-for-Difference (CFDs).
Trading the ASX 200 with CFDs
CFDs allow speculation in an underlying instrument without direct ownership of underlying shares or securities. This means you can trade the price action of an index like the ASX 200 with CFDs.
Trading the ASX 200 using CFDs offers several benefits. Firstly, CFDs may be traded using leverage, which will increase your profits in a winning trade. If the trade goes against you, leverage will also increase your losses accordingly. Thus, leverage is best used with caution and only by experienced traders.
Secondly, you can trade both long and short positions on the ASX 200 using CFDs. This allows you to potentially reap gains whether the index goes up or down, widening your profit potential.
Thirdly, you can start trading CFDs even with a small account, without the need to first gather up a large capital. Thus, CFDs provide greater capital efficiency as it frees up more of your trading capital which you can put into other strategies.
Here’s a simple illustration of how trading the ASX 200 with CFDs works.
You open a trade by choosing whether the index will go up or down. If the price goes with your position, you make a profit. If it goes against your position, you will incur a loss.
At the close of the contract, the difference in the price of the index is settled directly in your account. At no point during the process would you need to purchase or take ownership of ASX 200 stocks.
Analysing the ASX 200 market
Fundamental analysis
Just like with equities, fundamental analysis for the ASX 200 revolves around studying the macroeconomic environment, as well as important news and developments surrounding the constituent companies.
To be sure, the ASX 200 is more resilient to corporate developments than a single stock, so maintaining an awareness of the Australian economy on the whole is likely more important. Still, unexpected developments or shocks affecting the top-ranked constituents of the index can have a palpable effect, bringing surprise volatility.
Some important factors in fundamental analysis include economic data, corporate earnings, interest rates and more. We will discuss them in greater detail later on.
Technical analysis
Another method to understand and interpret the ASX 200 is through technical analysis. As its name suggests, this requires the use of a price chart and charting tools, as well as some knowledge of technical indicators and chart patterns. Technical analysis can help us form trading ideas, spot opportunities and approach trading the ASX 200 in a more informed manner.
You can consult our other guides for detailed explanations on technical indicators and technical analysis. It’s crucial to understand that these are merely tools that help us form an informed opinion on the state of the market. No indicator is 100% accurate, nor is there any that can predict which way the index will go.
Trend lines
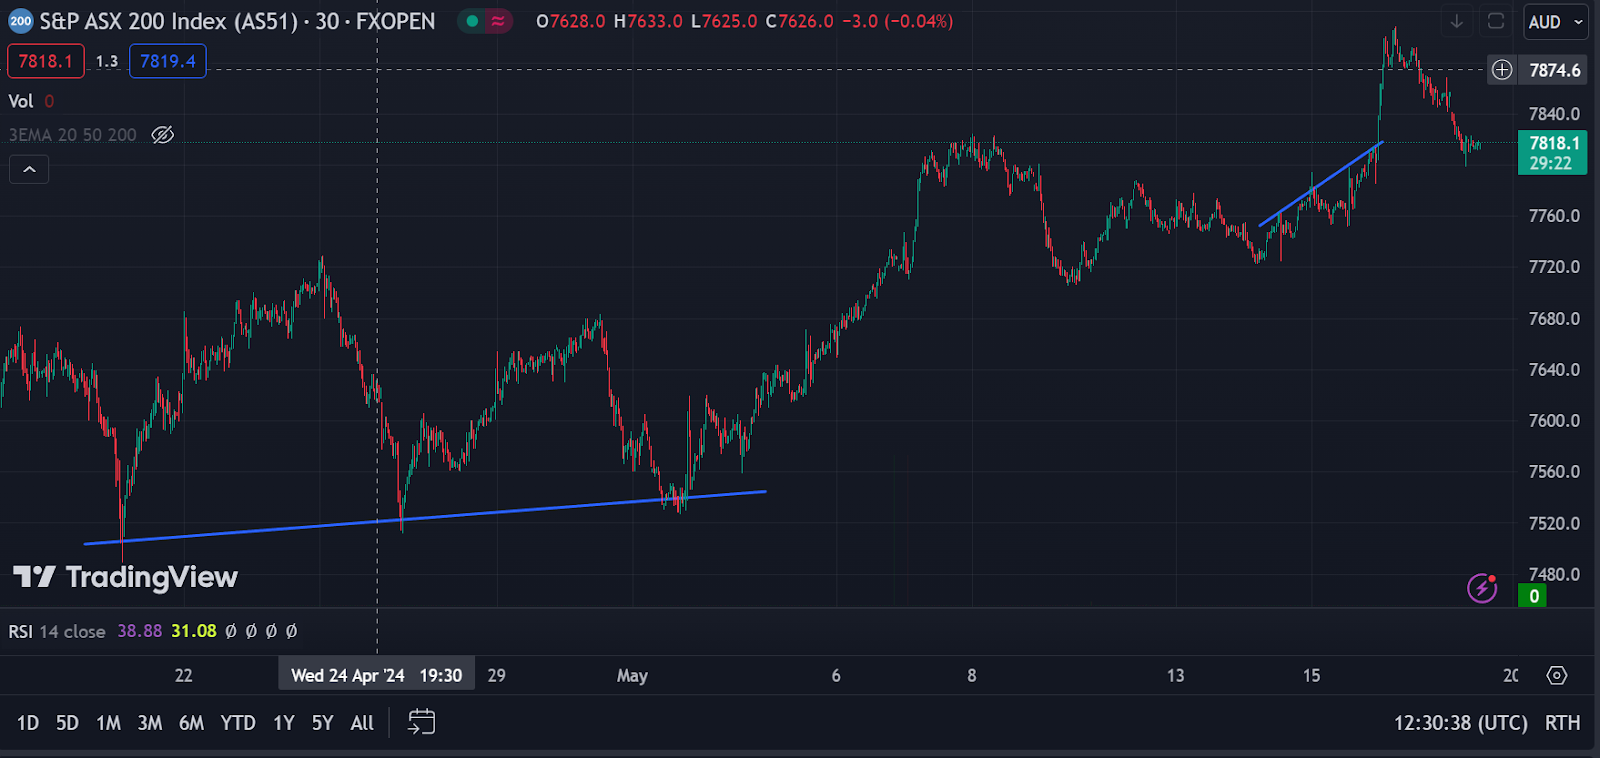
This screenshot shows the price chart of the ASX 200 index over a time frame of approximately 30 days. During this period, the index hiked up twice.
You can plot trend lines to help you spot upcoming price swings like these. We plotted two trend lines in blue, one on the left and on the right.
On the left, the trend line was plotted by joining as many price bottoms (lowest points of the candlestick chart) as possible. This makes the trend line a Line of Support. Observe that the ASX 200 bounced off the Line of Support three times. After the third bounce, the index spiked upwards.
This illustrates a general rule that the more times the price chart bounces up from the Line of Support, the greater the likelihood of a price upswing. In this case, the ASX 200 needed only 3 bounces to start a price rally.
Another way to spot a price trend is by noting the procession of price tops – how many higher highs are forming. On the right of the screenshot, we have plotted a short blue line connecting as many price tops (highest points on the candlestick chart) as possible. This makes the trend line a Line of Resistance.
Notice the upward slope of the Line of Resistance – this tells us that the index is consistently ending the trading day at a higher level than when it opened; in other words more higher highs are forming. This is generally a bullish indicator, which bore out in the ASX 200.
Relative Strength Index (RSI)
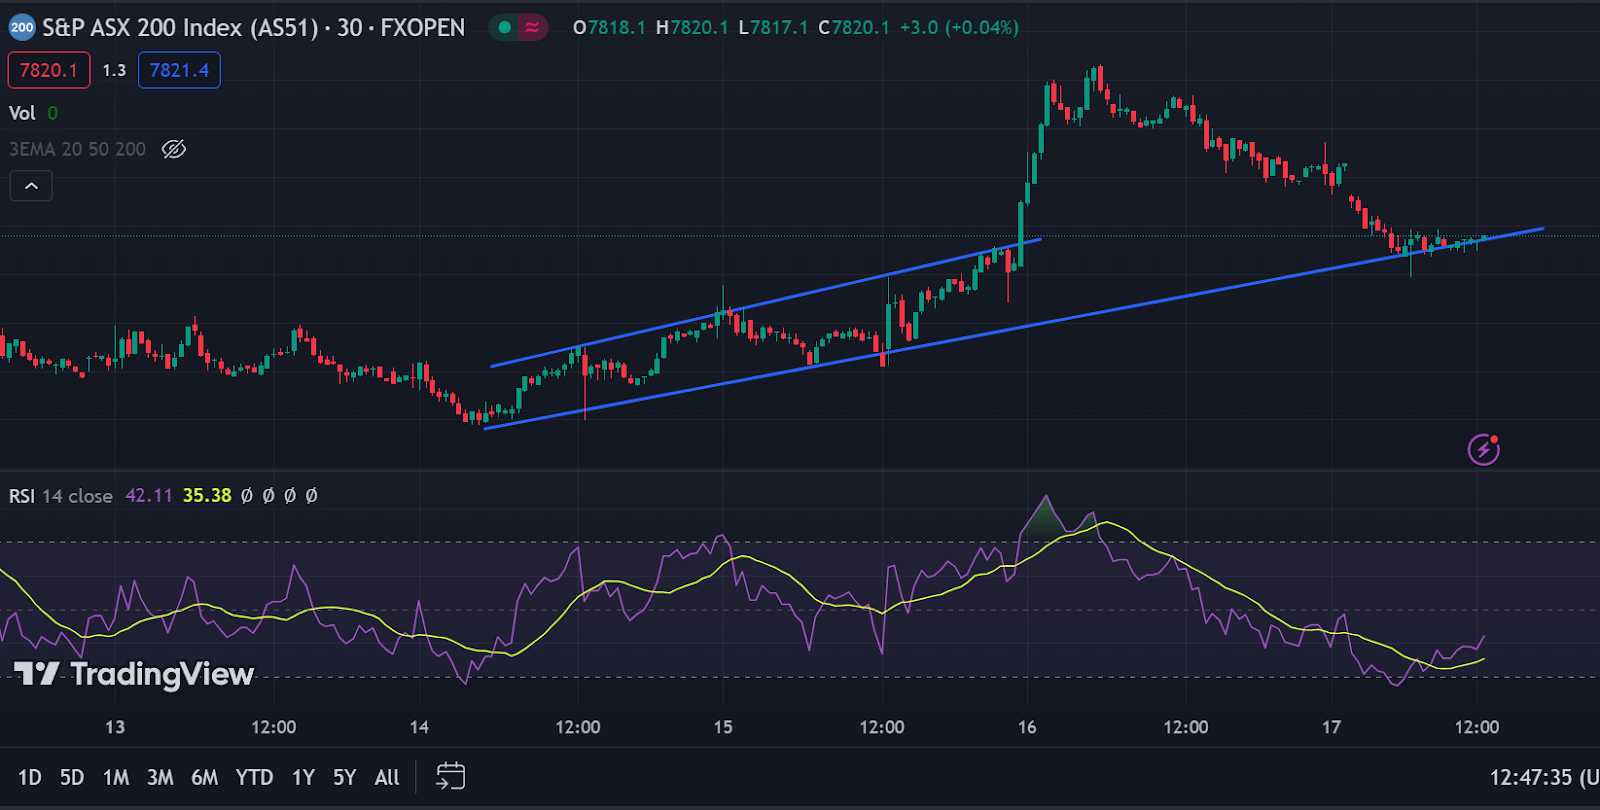
This is the same price chart of the ASX 200 but we’ve zoomed in on the most recent few days.
We’ve added another trend line in blue, this time a Line of Support, and also another technical indicator known as the Relative Strength Index.
The Line of Support extends from the previous low in the index, to its current low, clearly showing that the most recent price rally has run its course and a downtrend is likely.
We can confirm this by checking the RSI, which is at the lower half of the screenshot. Simply put, the RSI is an oscillator that is used to measure market momentum (which is also commonly used as a proxy for investor sentiment).
The RSI runs from 0 (no momentum) to 100 (maximum momentum). Readings lower than 30 indicate low market momentum, and readings higher than 70 signal high market momentum.
For the ASX 200, we can see that RSI is low, just above the 30-mark (the lower edge of the shaded purple area) – meaning that market momentum is flagging. The RSI seems to be headed upwards, but if market momentum falls further, the ASX 200 is likely to see a downtrend.
Understanding ASX 200 market factors
The ASX 200 can be impacted by different market factors to various degrees, and investors who ignore them can be caught off guard when trading. To lessen the chances of this happening, don’t neglect to consider the following factors when planning your trades.
Economic factors
Economic factors such as GDP, inflation, unemployment figures and consumer spending can have a large impact on the ASX 200, given that its constituents are likely to be sensitive to – or even the cause of – changes in important economic indicators.
While the AXS 200 often reflects the latest round of economic data, some traders may also base their outlook of the market on the performance of the AXS 200.
GDP figures are a key indicator of economic growth, and have a direct impact on the index. Poor GDP numbers can cause a sell-off of stocks tracked by the AXS 200, causing it to drop. On the other hand, better-than-expected GDP results can spark off market exuberance, lifting the index to higher levels.
Inflation is another essential economic factor to watch. High inflation can put pressure on corporate earnings, causing companies to struggle to meet market expectations. This can bring the ASX 200 down. Consumer spending can also decline as people spend less, which can further weaken corporate earnings.
Similarly, climbing unemployment can erode market confidence, causing stock sell-offs as investors cash out to supplement their dwindling incomes. On the other hand, strong employment in the face of high inflation or slow economic growth can help keep index levels up.
Company performance
Company performance, especially those of the largest constituents listed in the AXS 200, is an important factor that can trigger changes in the price of the index. Good company performance will buoy the ASX 200, while poor performance will tank the index.
Company news and events can also impact the index. In the wake of a scandal, it is not unusual for the share price of the affected company to drop, which can drag the index down by a few points.
Global events
While the AXS 200 is focused primarily on the Australian economy, the free trade nature of our modern economic system means the index can be affected by global events as well.
Geopolitical events such as wars, trade tariffs and even election results can interfere with natural market pricing, affecting corporate profits and causing market volatility and uncertainty.
Natural disasters can also have an impact. In March 2022, Queensland and New South Wales experienced devastating floods. This caused insurance claims to skyrocket, promoting shares of insurance firms listed on the ASX 200 to fall, creating a downward drag on the index [6].
Interest rates
Interest rates set by the Reserve Bank of Australia can help or harm the ASX 200. When interest rates are set too high, borrowing costs increase for businesses and consumers, slowing down the economy and bringing down the index readings.
Conversely, when interest rates fall, this can encourage spending and stimulate economic activity, helping the ASX 200 to strengthen.
Currency fluctuations
Exports of goods and services make up a significant portion of Australia’s economy, accounting for 25.43% of GDP in 2022 [7]. Some of the country’s major exports are metals such as iron and gold, oil and coal, and agricultural output such as meat and grain [8].
As such, fluctuations in exchange rates can also affect the ASX 200. An Australian Dollar that is too strong will make exports more expensive, which can crimp the profitability of export-dependent constituent stocks. Keeping the Australian Dollar at a competitive level can be helpful to the index.
Trading strategies for the ASX 200
With its diversified composition and high liquidity, the ASX 200 lends itself well to a variety of trading strategies. Let’s take a look at some short-, medium- and long-term strategies.
Short-term trading strategies
Day trading
Day trading utilises several short-term trades to capture profits as the ASX 200 fluctuates throughout the trading day. Instead of a few large wins, day traders aim for several small wins to quickly increase their returns.
One hallmark of day trading is that no positions are held overnight. This is to avoid overnight risk, where unexpected news or events after trading hours causes the index to make large gaps upwards or downwards, flipping the market on your trade.
News trading
News trading can be a viable alternative for those who do not wish to be constantly watching the markets. The idea here is to scan the market for news and developments that can potentially move the ASX 200, and planning your trades around them.
This offers traders a more relaxed trading style, but investors should be ready to quickly act on breaking news or events.
An economic calendar can help investors keep track of important news reports and information such as corporate earnings, economic reports, consumer trends, and the like.
Mid-term trading strategies
Swing trading
Swing trading aims to capture potential returns when the ASX 200 swings from one direction to the other.
A swing occurs when the index’s reading changes direction from up to down, or down to up. Swings can happen over several hours or a few days, while there can also be longer swings that last several weeks or months.
The concept behind swing trading is simple, but successfully executing it may not be so. Swing traders have to be able to properly identify swings when they happen, and know when to close their trades before a trend reversal takes hold. Missing such cues can undo what appeared to be a good trade. It’s essential to set reasonable profit targets and not give in to greed.
Long-term trading strategies
From 2014 to 2023, the ASX 200 generated positive returns for eight years, and had only two years in which returns were negative. The index’s 10-year annualised return is 7.76% [9].
With such consistent performance levels, the ASX 200 is a good candidate for long-term strategies.
As mentioned earlier, the ASX 200, being an index, cannot be owned or traded directly. However, investors can use index ETFs to invest in the ASX 200 over the long term.
Some popular ASX 200-tracking ETFs include:
- iShares Core S&P/ASX 200 ETF
- Intelligent Investor AUS Eq Inc ETF
- Lyxor Australia (S&P/ASX 200) ETF D EUR
When choosing index ETFs, don’t neglect to check the expense ratio. This is the fee paid to fund managers for overseeing the ETF, and expense ratios that are too high will eat away at your profits in the long run.
Risk management strategies when trading the ASX 200
Trading the ASX 200 benefits from its high liquidity and market significance, which generally contributes to its relative safety compared to other investments. However, proper risk management should still be implemented to avoid costly mistakes. Here are some tips to bear in mind [10].
Set proper trade sizes
You should not risk more than 2% of your capital in any one trade. Committing too much capital will cause your account to be quickly wiped out if you encounter a losing streak, which is a mathematical possibility when trading.
Make use of stop-loss and take-profit
One common mistake is overtrading – that’s when you hold your trade longer than you should, whether to try to recover your losses, or to gain more profit.
Stop-losses and take-profits can help to avoid overtrading, helping to build the discipline to close your trades in a timely manner.
A stop-loss can be set when the index falls below a key support level, this will cut a losing trade and limit your losses.
Meanwhile, a take-profit point can be set when the index approaches a key resistance level after a large move upwards. This may be a good time to sell and take profit, before consolidation takes place.
Use leverage with caution
Leverage is a double-edged sword that can harm or help your trade. Because both profits and losses are amplified with leverage, its use must be controlled. Reckless use can inflict losses that exceed your capital, putting your account in the negative.
Have a trading plan in place
Failing to plan is planning to fail, and nowhere is this saying more true than when trading. Understand and accept that successful trading requires logic and patience, and greed and emotion will only lead you down a bad path.
Draw up a trading plan to help you stay on the right track. This can be a journal that spells out your goals and objectives, strategies you will use, maximum risk per trade, and your budget limit for trading each week or month.
Use your trading plan to reflect on your success and failures, so that you can hone the discipline, knowledge and habits that will bring you long-term success.
Conclusion: Trade the ASX 200 with Vantage via CFDs
Trade Australia’s leading benchmark, the ASX 200, with Vantage CFDs to potentially benefit from the dynamic Australian stock market without direct ownership of underlying fund units or company shares. Benefit from tight spreads and low cost – starting from $0 per trade.
Explore opportunities to generate potential returns across diverse market conditions, with the choice to open long or short positions, and control risk with tools such as negative balance protection, price alerts and stop losses. With real time new alerts on our mobile app and trading platform, you get the power and flexibility to react quickly to market developments, and trade on the go.
Sign up for a live account and experience the Vantage advantage today.
References
- “S&P/ASX 200 Index: Meaning, Overview, Importance – Investopedia”. https://www.investopedia.com/terms/s/sp/asx-200-index.asp. Accessed 20 May 2024.
- “Cash market trading hours – ASX”. https://www.asx.com.au/markets/market-resources/trading-hours-calendar/cash-market-trading-hours. Accessed 20 May 2024.
- “ASX 24 Trading Calendar – ASX”. https://www.asx.com.au/markets/market-resources/asx-24-trading-calendar. Accessed 20 May 2024.
- “ASX Sectors – Market Index”. https://www.marketindex.com.au/asx-sectors. Accessed 20 May 2024.
- “Top 50 by Market Cap – ASX”. https://www.asx.com.au/markets/trade-our-cash-market/equity-market-prices/top-50-market-cap. Accessed 20 May 2024.
- “’$2 billion cost’: How are the floods impacting ASX 200 insurance shares this week? – The Motley Fool”. https://www.fool.com.au/2022/03/03/2-billion-cost-how-are-the-floods-impacting-asx-200-insurance-shares-this-week/. Accessed 20 May 2024.
- “Australia – Exports Of Goods And Services (% Of GDP) – Trading Economics”. https://tradingeconomics.com/australia/exports-of-goods-and-services-percent-of-gdp-wb-data.html. Accessed 20 May 2024.
- “Biggest Exporting Industries in Australia in 2024 – IBIS World”. https://www.ibisworld.com/australia/industry-trends/biggest-exporting-industries/. Accessed 20 May 2024.
- “S&P/ASX 200 – S&P Dow Jones Indices”. https://www.spglobal.com/spdji/en/indices/equity/sp-asx-200/#overview. Accessed 20 May 2024.
- “Risk Management Techniques for Active Traders – Investopedia”. https://www.investopedia.com/articles/trading/09/risk-management.asp. Accessed 20 May 2024.