Dollar dips as several majors see technical breakouts

- Stocks turn lower, gold surge continues as Trump trades weigh on markets
- USD retreats on “tariff fatigue”, yen surges on BoJ rate hike bets
- US-Ukraine discuss “improved” minerals deal, US puts Russian sanctions on the table
- Walmart’s earnings forecast falls short on economic uncertainty
FX: USD fell through the April 2024 low and its 100-day SMA at 106.41/42. The 38.2% Fib level of the September to January rally sits at 106.34. The midpoint of that move is below at 105.61. Tariff volatility has definitely eased back, though it might return around April when the US Commerce Department reports back to President Trump. Dollar selling ramped up with likely bid Treasuries in the background helping, in wake of Treasury Secretary Bessent’s remarks on debt issuance. He said terming out US debt is “a long way off”. Yen strength did also turn the index lower.
EUR moved just above 1.05 and a resistance zone. Above here is the 100-day SMA at 1.0558. ECB hawks are starting to question the policy easing cycle amid inflation and tariff uncertainty. Sunday’s German election is getting closer, with a win for the centre-right CDU expected. But a jump in support for the far right AfD could turn things more volatile though a mixed result will take months to likely get a working government together.
GBP broke out from a bullish consolidation pattern. The 100-day SMA is at 1.2658 and the 200-day at 1.2787. Soft consumer confidence figures did not dent sterling, with the BoE currently cautious on aggressive rate cuts.
USD/JPY tanked as the yen outperformed strongly. JPY is actually the top performing major this month and also year-to-date. Talk of more BoJ rate hikes has increased recently, with 21bps currently priced into the July meeting. Today’s nationwide inflation data could trigger more selling in USD/JPY, with yen bulls’ eyes on 149.22 and below. That’s the halfway point of the September to January rally.
AUD broke to the upside after consolidating in the recent range around 0.6250. The next upside target is 0.6413/25. Yesterday’s jobs data remained strong and confirm he RBA’s guidance that it is too early for a prolonged easing cycle. USD/CAD underperformed, lagging its commodity dollar peers. Support is 1.4150.
US stocks: The benchmark S&P 500 fell 0.43% to settle at 6,117. The tech-dominated Nasdaq finished down 0.48% at 22,068. The Dow lost 1.01% to close at 44,176. US indices all closed in the red, as did the majority of sectors as sentiment was soured amid continued heightened tensions between US and Ukraine as well as dismal Walmart guidance. Financials were worst off with consumer discretionary and staples not far behind. Energy, real estate and healthcare – defensives- led the gains.
Asian stocks: Futures are in the red. Stocks mostly dropped on Trump’s backlash against Ukrainian President Zelensky and more tariff threats. The ASX 200 fell for a third day in a row as mining and financials underperformed. The Nikkei 225 fell below 39,000 to its 200-day SMA at 38,673. The stronger yen and potentially more hawkish BoJ are not helping. The Hang Seng and Shanghai Comp dipped in line with the other regional indices. But reports of a bigger and better trade deal with China surfaced.
Gold made another fresh record high after initially getting sold into the US session. See below for more detail.
Day Ahead – PMIs, UK Retail Sales
Expectations are for January UK retail sales to print at 0.2%, up from the -0.3% in December. A rebound in food sales is predicted by economists. Other sales activity indicators have been mixed, but a solid start to the year is likely, especially due to weak comparables. The BoE seems to be in gradual easing mode with a 25bps cut per quarter. GBP/USD broke to the upside and is nearing its 100-day SMA at 1.2664.
PMIs are good leading indicators with the eurozone data the most widely followed. Manufacturing firms may be attempting to front run potential US tariffs, as they did in January. After the flat end to the final quarter last year, more weakening of activity in Europe would be of concern, with so many headwinds on the horizon. The euro continues to toy with the long-term low from October 2023 at 1.0448.
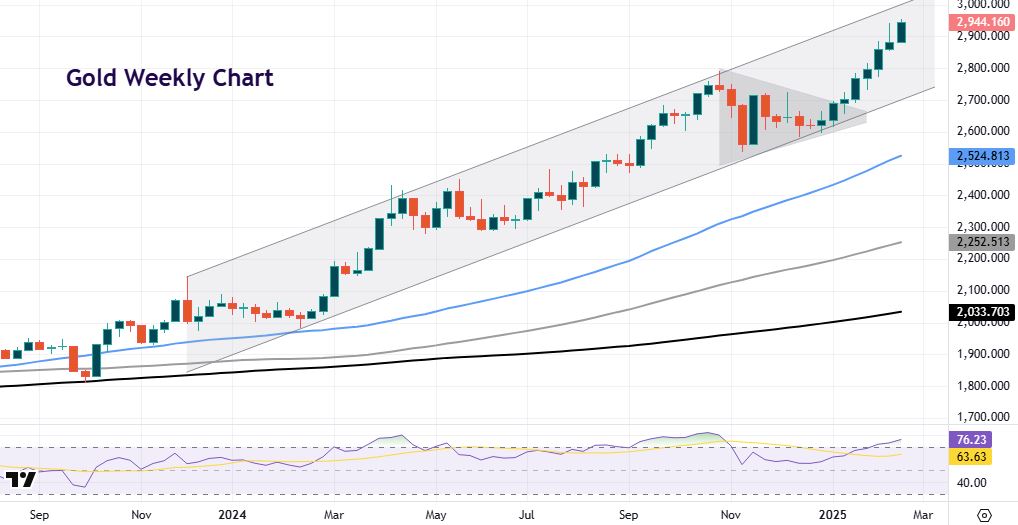
Chart of the Day – Gold march higher continues
We wrote yesterday how several investment banks were upgrading their year end price targets in the yellow metal. UBS upgraded theirs to $3,200, while Goldman Sachs went to $3100 from $2890. Many gold gurus are also speculating that London, the world’s largest gold hub is under pressure with physical deliveries and struggling to meet demand. Long-term reasons underpinning support for gold include central bank buying, fiscal and inflation risks, debt debasement and dedollarisation.
The upward channel remains firmly intact with the neat breakout from the triangle pattern around $2700. It’s now eight weeks of straight gains, that was last seen in August 2020. The round number of $3000 seemingly beckons, though haven demand could lessen in the months ahead if the ceasefire possibility in Ukraine turns more permanent. The rejection of the intraday top at $2954 is a warning sign, with prices overbought on several timeframes.