Tariffs roil markets, euro surges on geopolitical news

- US and Ukraine prepare to sign minerals deal after Zelensky reaches out
- EUR soars as Germany will set up a €500bn infrastructure and defence fund
- US stocks eras $3.6trn Trump rally amid wild intraday two-way price action
- Dollar tumbles on euro strength again and increased Fed rate cut bets
FX: USD broke down, though (as we always say in our weekly webinar) the weighting in the Dollar Index is dominated by the euro, with around 57%. GBP and JPY are next biggest with 12 to 13% each. Those three currencies led the gainers. The dollar suffered from worries around US exceptionalism even though common wisdom says it should benefit from tariffs. US stocks are probably more of a guide for the greenback at present, as well as Treasury yields. Sellers broke through the confluence of support around 106.34/51 on the chart. Next stop 105.16 and the 200-day SMA at 105.00.
EUR surged again and through the resistance zone around 1.0530. The rally picked up steam after the European close. Will new defence spending lead to broader economic growth? That’s questionable so the real driver for the euro at present is the repricing of the Fed versus the ECB (ie the steepening of the European bond curve). That has seen the two-year US-EZ spread narrow a huge 37bp in less than a month. We note the Dax sold off over 3.5% yesterday.
GBP performed relatively well as cable broke to the upside and is touching the 200-day SMA at 1.2785 and through a Fib level at 1.2760. As we have said previously, sterling is being driven by external inputs. The UK could be fairly immune from any trade war with PM Starmer currently in Trump’s good books after his positive Washington visit.
USD/JPY looked to be breaking down through strong support around 149.22. But the 10-year US Treasury yield rebounded, with major support around 4.13-4.18%. The currency pair finished in the green with a strong advance in the last hour of US trading. We are also watching some of the yen crosses which also broke out but then rebounded. CHF did well too as markets searched for havens amid the trade turmoil.
AUD printed another green day after sharp two-way price action. The long-term level at 0.6169 is key support. GDP is in focus today. USD/CAD barely made new highs for the recent move after the tariff announcement. That could mean markets are sceptical that 25% tariffs will be in place for long. Two-year spreads between US/Canada have narrowed significantly in recent weeks cushioning the tariff hammer for the loonie. The major eventually finished lower and through 1.44.
US stocks: The benchmark S&P 500 lost 1.22% to settle at 5,778. The tech-laden Nasdaq finished down 0.36% at 20,352. The Dow lost 1.55% to close at 42,530. The S&P 500 is now off 0.08% from the November US election day and close to 6% from its record close of 6,144 posted in mid-February. Reuters reported that the equal-weighted S&P500, which negates the market cap impact, outperformed the traditional cap weight again and is now 2% ahead year-to-date. At one point, the Nasdaq fell over 1% which meant it had experienced a drop of more than 10%, so an official ‘correction’, from its recent closing high. Tesla again underperformed, likewise automakers who are seen being impacted heavily by tariffs. About 15% of parts in a Model Y sold in the US come from Mexico.
Asian stocks: Futures are in the red. APAC stocks struggled after an awful day Stateside. The ASX 200 dipped below its 200-day SMA with nearly all sectors down. Energy underperformed after the recent drop in oil prices. The Nikkei 225 fell below 37,000 before retracing as currency strength increasingly becomes a factor. The Hang Seng and Shanghai Composite initially sold off on the tariff news and potential countermeasures by China. But the “Two Sessions” gathering began with stimulus plans expected to be rolled out.
Gold jumped again after finding support on Friday at $2,857, that’s the minor Fib level (23.6%) of the November to February rally. The risk off mood continued, but with the dollar struggling and yields hitting fresh lows before bouncing.
Day Ahead – Australia GDP and US ISM Services
Economists expect the pace of economic growth to have improved modestly over the final months of the year. Q4 GDP is forecast to have grown by 0.4% (1.1%yr). A recovery in private demand is predicted plus easing price pressures and tax cuts should help. AUD has been hit by poor risk sentiment with bears looking at 0.6169 as key long-term support.
The February non-manufacturing ISM headline figure is seen rising to 53.0 from 52.8. Services activity has remained in expansionary territory since July 2024. Other business surveys point to downside risks, so we’ll be watching the employment component and also the prices paid reading with a focus on concerns about inflation rising.
Regarding tariffs, the current situation is probably best summed up by a well-known US investment bank’s Chief Strategist – “The trouble is that they raise prices, slow economic growth, cut profits, increase unemployment, worsen inequality, diminish productivity and increase global tensions. Other than that, they’re fine.” In which light, we would expect some kind of agreement going forward at some stage, though volatility will be heightened. For good measure, the counter reason to this would be if tariffs are seen as a big revenue raiser which could mean they will broaden and be slow to reverse.
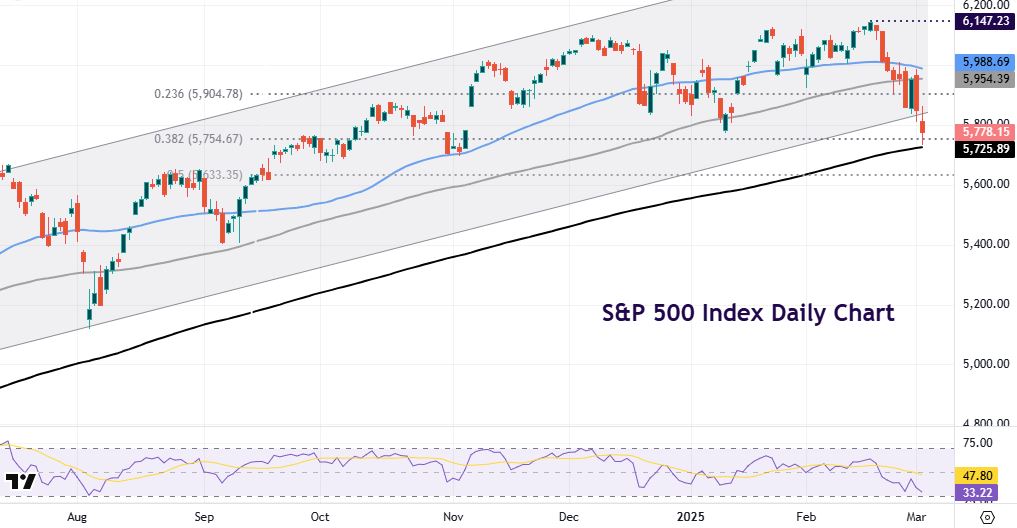
Chart of the Day – S&P 500 nears 200-day SMA
We wrote last Tuesday about how the Nasdaq had hit resistance again and tech stocks looked weak. There have been rising concerns over high megacap and questions about their growth prospects and plans for huge spending to chase the AI boom. The same applies to the wider benchmark index which has been driven by the tech titans for a few years. Along with these negatives, US data has started to soften and then tariffs have been announced very recently. This is not good news for the broader blue-chip index. The suspension of US military aid to Ukraine has also hit risk markets.
Prices got close to the 200-day SMA at 5,725 which is just below a major Fib level (38.2%) of the August to February rally at 5,754. That should be initial support, with the November swing low at 5,696. Below here is the midpoint of that rally at 5,633. We note the long-held bull channel from the November 2023 was broken.